Test Jupyter Project
 Titanic
Titanic Data Challenge
Introduction
Kaggle Description:
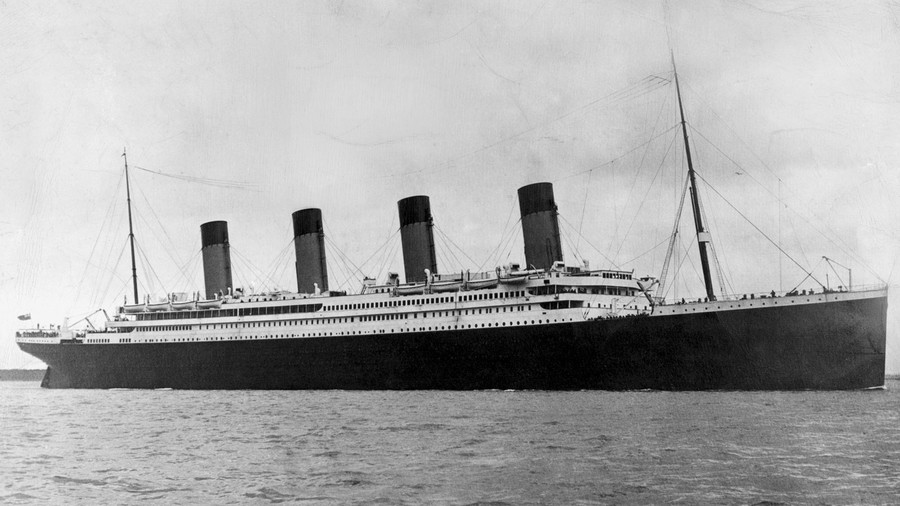
On April 15, 1912, during her maiden voyage, the widely considered “unsinkable” RMS Titanic sank after colliding with an iceberg. Unfortunately, there weren’t enough lifeboats for everyone onboard, resulting in the death of 1502 out of 2224 passengers and crew.
While there was some element of luck involved in surviving, it seems some groups of people were more likely to survive than others.
In this challenge, we ask you to build a predictive model that answers the question: “what sorts of people were more likely to survive?” using passenger data (ie name, age, gender, socio-economic class, etc).
Goal: To predict whether or not a passenger will survive the sinking of the Titanic based on provided information
Let's begin! First, let's do some boilerplate setup.
Imports
%reload_ext autoreload
%autoreload 2

# custom helpers
from helpers.helper import get_splits
# data handling
import numpy as np
import pandas as pd
# output
from termcolor import cprint
import matplotlib.pyplot as plt
import seaborn as sns

cprint('All Modules Imported!', 'green')
[32mAll Modules Imported![0m
Data Import
import os
os.listdir('./data/')
['gender_submission.csv', 'test.csv', 'train.csv']
train_data = pd.read_csv('./data/train.csv', index_col='PassengerId')
test_data = pd.read_csv('./data/test.csv', index_col='PassengerId')

cprint('Data Imported!', 'green')
cprint('Training Data Example:', 'cyan')
display(train_data)
[32mData Imported![0m
[36mTraining Data Example:[0m
| Survived | Pclass | Name | Sex | Age | SibSp | Parch | Ticket | Fare | Cabin | Embarked | |
|---|---|---|---|---|---|---|---|---|---|---|---|
| PassengerId | |||||||||||
| 1 | 0 | 3 | Braund, Mr. Owen Harris | male | 22.0 | 1 | 0 | A/5 21171 | 7.2500 | NaN | S |
| 2 | 1 | 1 | Cumings, Mrs. John Bradley (Florence Briggs Th... | female | 38.0 | 1 | 0 | PC 17599 | 71.2833 | C85 | C |
| 3 | 1 | 3 | Heikkinen, Miss. Laina | female | 26.0 | 0 | 0 | STON/O2. 3101282 | 7.9250 | NaN | S |
| 4 | 1 | 1 | Futrelle, Mrs. Jacques Heath (Lily May Peel) | female | 35.0 | 1 | 0 | 113803 | 53.1000 | C123 | S |
| 5 | 0 | 3 | Allen, Mr. William Henry | male | 35.0 | 0 | 0 | 373450 | 8.0500 | NaN | S |
| ... | ... | ... | ... | ... | ... | ... | ... | ... | ... | ... | ... |
| 887 | 0 | 2 | Montvila, Rev. Juozas | male | 27.0 | 0 | 0 | 211536 | 13.0000 | NaN | S |
| 888 | 1 | 1 | Graham, Miss. Margaret Edith | female | 19.0 | 0 | 0 | 112053 | 30.0000 | B42 | S |
| 889 | 0 | 3 | Johnston, Miss. Catherine Helen "Carrie" | female | NaN | 1 | 2 | W./C. 6607 | 23.4500 | NaN | S |
| 890 | 1 | 1 | Behr, Mr. Karl Howell | male | 26.0 | 0 | 0 | 111369 | 30.0000 | C148 | C |
| 891 | 0 | 3 | Dooley, Mr. Patrick | male | 32.0 | 0 | 0 | 370376 | 7.7500 | NaN | Q |
891 rows × 11 columns
Process
- Figure out which features we can safely drop/keep.
- Encode features that need encoding (label encoding, categorical encoding).
- Start feature engineering some new columns so we have a wider predicition set.
- Do feature selection to determine which features are not needed and find the best combination of features to use.
- Research and test what models would be best for our situation and train/test different models.
- Train and predict on the train/test sets.
- Finally, output everything to a new CSV.
Tools
Our current model options are: LightGBM, RandomForestRegressor, ExtraTreesRegressor.
I also want to use a pipeline to keep everything organized into various steps.
Getting Started
Feature Engineering
So the columns we have are:
| Variable | Definition | Key |
|---|---|---|
| survival | Survived or not | 0 = No, 1 = Yes |
| pclass | Ticket class | 1 = 1st, 2 = 2nd, 3 = 3rd |
| sex | Sex | |
| age | Age in years | |
| sibsp | Num of siblings / spouses aboard | |
| parch | Num of parents / children aboard | |
| ticket | Ticket number | |
| fare | Passengar fare | |
| cabin | Cabin number | |
| embarked | Port of embarkation | C = Cherbourg, Q = Queenstown, S = Southampton |
Looking at these descriptions, we can probably disregard
- Name
- Ticket number
Ticket number is a … maybe, as we aren't entirely sure how ticket numbers are handed out.
Let's get to engineering.
Model Createion Steps
- Choose feature cols based on feature table and relevant data
- Split into train/valid/test sets
- Generate features
- Interactions
- …
- Setup pipeline
- Imputation to fill in N/A values
- Categorical encoding, CatBoost
- Standardize values
- Feature Selection
- Train
Feature Generation / Engineering
# 1. Choose our feature cols based on feature table above
numerical_cols = ['Age', 'SibSp', 'Parch', 'Fare']
categorical_cols = ['Pclass', 'Sex', 'Cabin', 'Embarked']
target_col = 'Survived'
# Let's make some features
from itertools import combinations

interactions = pd.DataFrame(index=train_data.index)
for comb in combinations(categorical_cols, 2):
    new_feat = comb[0] + "_" + comb[1]
    interactions[new_feat] = train_data[comb[0]].astype(str) + "_" + train_data[comb[1]].astype(str)
    categorical_cols.append(new_feat)
train_data = train_data.join(interactions)
display(train_data)
# 2. Split sets
train, valid, _ = get_splits(train_data)
X_train = train.drop([target_col], axis=1)
y_train = train[target_col]
X_valid = valid.drop([target_col], axis=1)
y_valid = valid[target_col]
display(X_train)
| Survived | Pclass | Name | Sex | Age | SibSp | Parch | Ticket | Fare | Cabin | Embarked | Pclass_Sex | Pclass_Cabin | Pclass_Embarked | Sex_Cabin | Sex_Embarked | Cabin_Embarked | |
|---|---|---|---|---|---|---|---|---|---|---|---|---|---|---|---|---|---|
| PassengerId | |||||||||||||||||
| 1 | 0 | 3 | Braund, Mr. Owen Harris | male | 22.0 | 1 | 0 | A/5 21171 | 7.2500 | NaN | S | 3_male | 3_nan | 3_S | male_nan | male_S | nan_S |
| 2 | 1 | 1 | Cumings, Mrs. John Bradley (Florence Briggs Th... | female | 38.0 | 1 | 0 | PC 17599 | 71.2833 | C85 | C | 1_female | 1_C85 | 1_C | female_C85 | female_C | C85_C |
| 3 | 1 | 3 | Heikkinen, Miss. Laina | female | 26.0 | 0 | 0 | STON/O2. 3101282 | 7.9250 | NaN | S | 3_female | 3_nan | 3_S | female_nan | female_S | nan_S |
| 4 | 1 | 1 | Futrelle, Mrs. Jacques Heath (Lily May Peel) | female | 35.0 | 1 | 0 | 113803 | 53.1000 | C123 | S | 1_female | 1_C123 | 1_S | female_C123 | female_S | C123_S |
| 5 | 0 | 3 | Allen, Mr. William Henry | male | 35.0 | 0 | 0 | 373450 | 8.0500 | NaN | S | 3_male | 3_nan | 3_S | male_nan | male_S | nan_S |
| ... | ... | ... | ... | ... | ... | ... | ... | ... | ... | ... | ... | ... | ... | ... | ... | ... | ... |
| 887 | 0 | 2 | Montvila, Rev. Juozas | male | 27.0 | 0 | 0 | 211536 | 13.0000 | NaN | S | 2_male | 2_nan | 2_S | male_nan | male_S | nan_S |
| 888 | 1 | 1 | Graham, Miss. Margaret Edith | female | 19.0 | 0 | 0 | 112053 | 30.0000 | B42 | S | 1_female | 1_B42 | 1_S | female_B42 | female_S | B42_S |
| 889 | 0 | 3 | Johnston, Miss. Catherine Helen "Carrie" | female | NaN | 1 | 2 | W./C. 6607 | 23.4500 | NaN | S | 3_female | 3_nan | 3_S | female_nan | female_S | nan_S |
| 890 | 1 | 1 | Behr, Mr. Karl Howell | male | 26.0 | 0 | 0 | 111369 | 30.0000 | C148 | C | 1_male | 1_C148 | 1_C | male_C148 | male_C | C148_C |
| 891 | 0 | 3 | Dooley, Mr. Patrick | male | 32.0 | 0 | 0 | 370376 | 7.7500 | NaN | Q | 3_male | 3_nan | 3_Q | male_nan | male_Q | nan_Q |
891 rows × 17 columns
| Pclass | Name | Sex | Age | SibSp | Parch | Ticket | Fare | Cabin | Embarked | Pclass_Sex | Pclass_Cabin | Pclass_Embarked | Sex_Cabin | Sex_Embarked | Cabin_Embarked | |
|---|---|---|---|---|---|---|---|---|---|---|---|---|---|---|---|---|
| PassengerId | ||||||||||||||||
| 1 | 3 | Braund, Mr. Owen Harris | male | 22.0 | 1 | 0 | A/5 21171 | 7.2500 | NaN | S | 3_male | 3_nan | 3_S | male_nan | male_S | nan_S |
| 2 | 1 | Cumings, Mrs. John Bradley (Florence Briggs Th... | female | 38.0 | 1 | 0 | PC 17599 | 71.2833 | C85 | C | 1_female | 1_C85 | 1_C | female_C85 | female_C | C85_C |
| 3 | 3 | Heikkinen, Miss. Laina | female | 26.0 | 0 | 0 | STON/O2. 3101282 | 7.9250 | NaN | S | 3_female | 3_nan | 3_S | female_nan | female_S | nan_S |
| 4 | 1 | Futrelle, Mrs. Jacques Heath (Lily May Peel) | female | 35.0 | 1 | 0 | 113803 | 53.1000 | C123 | S | 1_female | 1_C123 | 1_S | female_C123 | female_S | C123_S |
| 5 | 3 | Allen, Mr. William Henry | male | 35.0 | 0 | 0 | 373450 | 8.0500 | NaN | S | 3_male | 3_nan | 3_S | male_nan | male_S | nan_S |
| ... | ... | ... | ... | ... | ... | ... | ... | ... | ... | ... | ... | ... | ... | ... | ... | ... |
| 709 | 1 | Cleaver, Miss. Alice | female | 22.0 | 0 | 0 | 113781 | 151.5500 | NaN | S | 1_female | 1_nan | 1_S | female_nan | female_S | nan_S |
| 710 | 3 | Moubarek, Master. Halim Gonios ("William George") | male | NaN | 1 | 1 | 2661 | 15.2458 | NaN | C | 3_male | 3_nan | 3_C | male_nan | male_C | nan_C |
| 711 | 1 | Mayne, Mlle. Berthe Antonine ("Mrs de Villiers") | female | 24.0 | 0 | 0 | PC 17482 | 49.5042 | C90 | C | 1_female | 1_C90 | 1_C | female_C90 | female_C | C90_C |
| 712 | 1 | Klaber, Mr. Herman | male | NaN | 0 | 0 | 113028 | 26.5500 | C124 | S | 1_male | 1_C124 | 1_S | male_C124 | male_S | C124_S |
| 713 | 1 | Taylor, Mr. Elmer Zebley | male | 48.0 | 1 | 0 | 19996 | 52.0000 | C126 | S | 1_male | 1_C126 | 1_S | male_C126 | male_S | C126_S |
713 rows × 16 columns
Pipeline
# machine learning
from sklearn import feature_selection
from sklearn import preprocessing
# Pipeline code originally copied from 3_intermediate_training_summary
from helpers.helper import PipelineFS
from sklearn.impute import SimpleImputer
from sklearn.compose import ColumnTransformer
from sklearn.metrics import mean_absolute_error
from sklearn.preprocessing import StandardScaler
# conda install -c conda-forge category_encoders
from category_encoders import CatBoostEncoder
# conda install -c conda-forge lightgbm
import lightgbm as lgb
from sklearn.model_selection import cross_val_score
def get_lgb_pipeline_score(X, y, params={'n_estimators':10,'num_leaves':64,'rate':0.1,'early_stopping_rounds':10}):
    """
    Run LightBGM pipeline on the provided parameters.
    Scores based on cross_validation with 5 folds.

    params: Python object of params with the following keys
        n_estimators: number of estimators to use in pipeline, Default: 10
        num_leaves: num_leaves in lgb model, Default: 64
        rate: learning rate, Default: 0.1
        early_stopping_rounds: how many rounds to stop after if low variance, Default: 10
    """
    # Preprocessing for numerical data (fill in NA)
    numerical_transformer = PipelineFS(
        steps=[
            ('imputer', SimpleImputer(strategy='mean')),
            ('scaler', StandardScaler())
        ]
    )

    # Preprocessing for categorical data
    categorical_transformer = PipelineFS(
        steps=[
            ('imputer', SimpleImputer(strategy='most_frequent')),
            ('catboost', CatBoostEncoder())
        ]
    )

    # Bundle preprocessing for numerical and categorical data
    preprocessor = ColumnTransformer(
        transformers=[
            ('num', numerical_transformer, numerical_cols),
            ('cat', categorical_transformer, categorical_cols)
        ]
    )

    model = lgb.LGBMClassifier(n_estimators=params['n_estimators'], num_leaves=params['num_leaves'], learning_rate=params['rate'])

    # Bundle preprocessing and modeling code in a pipeline
    my_pipeline = PipelineFS(
        steps=[
            ('preprocessor', preprocessor),
            ('model', model)
        ],
        verbose=False
    )
    # Preprocessing of training data, fit model
    # my_pipeline.fit(X_train, y_train)
    # cprint('Fit!', 'green')
    # Preprocessing of validation data, get predictions
    scores = cross_val_score(my_pipeline, X, y, cv=5)
    return scores.mean()
# get_lgb_pipeline_score(X_train, y_train)

# results = {}
# params={'n_estimators':10,'num_leaves':64,'rate':0.1,'early_stopping_rounds':10}
# for i in range(50, 1001, 50):
#     params['n_estimators'] = i
#     results[i] = get_lgb_pipeline_score(X_train, y_train, params=params)
# print(results)
Basic steps for the future
- Deal with missing values
- Deal with zeroes
- Encoding categorical variables
- Creating new features
- Interactions
- Transforming features
- Normalization/Outliers
- Feature Analysis
- Feature types
- How feature correlates to target
- Graphs Graphs Graphs
- Model fitting
- outlier removal
- optimization
Also, should we use Pipelines from now on?
- Yes
- No
Notes from example kernel
So far so good, but compared to others…not great. Below are some notes after looking at some example kernels.
- Combine the train and test data sets into a single dataframe to make feature transformation easier.
- Get the ids (indexes) of both the test and train sets so that they can be extracted again later.
- When filling in N/A values, be sure to figure out what N/A ACTUALLY means. Do we need to persist that value as something else? ie, in housing data, if garage is N/A, that just means the house doesn't have a garage, which is data we want to persist
- When creating features, it takes a little brain/common sense to figure out interactions. One way is to yes, just create a ton, but for finding INTERESTING interactions, you really gotta sit and think.
- For example, with the housing data, instead of just comparing different area values. Large properties will have large areas with high sale prices by default. But what is more intersting maybe is the fraction of the base that is of each different room type.
- GRAPHS
- USE SCATTERPLOTS. They are amazing for visualizing the correlation of a feature vs target.
- Same as above, GRAPH GRAPH GRAPH. Another useful graph is graphing the different means of the target. This can help to find outliers.
- Correlation. How do the current features correlate to the target?
- Optmization tricks:
- use a model to predict values for filling in NaN
Tyler Welsh
Full Stack and Lead Backend Engineer
Interests include Machine Learning, Neural Networks, AI in Games, Full-Stack Development, and learning to make witty sentences.